Using machine learning to predict fill factor and frequency of grating couplers
Accurate measurement of grating coupler properties is important for reliable testing of photonic integrated circuits. But how can you distinguish between a problem with the grating coupler itself and an issue with the test procedure? Together with LioniX, Nobleo has explored a machine learning-based method to measure variations in grating coupler properties using high-magnification microscopy images.
The challenge of testing grating couplers
Grating couplers are key components on photonic wafers. The grating couplers are used typically to insert light into the Photonic Integrated Chip (PIC) and/or to measure light coming out of the PIC. If these components somehow do not work properly, the function of the PIC is compromised.
Interacting with grating couplers typically requires positioning of a fiber under the right angle in front of the grating coupler. The procedure for fiber alignment is technically challenging because of the mechanical tolerances. A complicating factor is that coupling efficiency depends on the optical properties of the grating coupler. If the frequency and fill factor of the grating coupler is slightly different, coupling efficiency can drop dramatically.
Because of the technical complexity of the test procedure, it is not easy to determine if a PIC test fails because of the properties of the grating coupler on the PIC or if the test procedure is somehow not executed properly. Therefore Nobleo has been exploring the possibility to measure the fill factor and frequency of grating couplers from high-magnification microscopy together with Lionix.
Using anomaly detection to identify variations
The core idea is to use an anomaly detection (AD) as a one-class or reference-based method: the model is trained only on structures that are assumed to represent normal fabrication, namely the reference grating couplers (GCs) on a given wafer. After training, new structures can be compared against this learned reference. Structures that resemble the training set receive a low anomaly score, whereas structures that deviate from the learned reference receive a higher score. Fig. 1 shows an example of a heatmap generated by an anomaly detector.

Figure 1 Grating coupler image (125 nm/pixel resolution) with heatmap overlay from the anomaly detector (left) and the same structure imaged with a CDSEM to obtain a ground truth for the validation of algorithm performance.
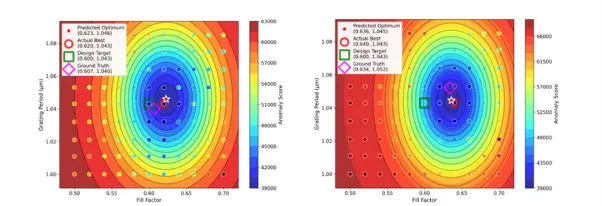
This makes AD attractive for process monitoring, because it does not require an explicit label for every possible defect or process shift. Instead, it provides a generic way to quantify deviation from nominal behavior. The anomaly score is not interpreted as a defect label on its own, but as a similarity measure that can be linked back to a known grid of fill factor and grating period values.

Figure 2 The figure shows the grid of grating couplers with a known fill factor and frequency as a regular dot pattern; in addition the figure shows the different estimates of the grating coupler and fill factor values associated with the PIC, namely the reference value measured with CD-SEM (purple), the value from the design (green) and the measured value measured by the anomaly detection (red).
Validation and measurement sensitivity
The method has been validated with a set of wafers with a slightly different fill factors to understand the robustness and sensitivity of the method. The graph shows that the method consistently shows differences in fill factor variations as small as 20 nm.

Figure 3 Estimated fill factor from a model trained on a reference of wafer (B1), applied to 4 grids on 4 other wafers with the same material and 2 different production processes. The error bars correspond to the standard deviation of the Gaussian AD score fit.
Practical applications and future potential
Beyond measurement sensitivity, the approach also offers practical advantages for wafer inspection and process monitoring. A practical advantage is that the method can be applied to standard optical microscope images acquired by scanning the wafer, rather than relying on SEM for every site.
On a fundamental level, this approach is not restricted to grating couplers. Theoretically the method can be used to any shapes. In addition, both model training and inference are fast, making the approach suitable for rapid screening once the image acquisition pipeline is in place.
Discuss your photonic metrology challenge with us
Are you facing challenges in measuring grating coupler properties or validating photonic wafer performance? Our engineers would be happy to explore how we can help. Get in touch using the contact form below.